1. Downloads by Country
If you’ve ever wondered why Transformers movies keep getting made even with a Rotten Tomato rating of 18%, check out these stats from BoxOfficeMojo for the last movie:
 It’s not really the US market that bolsters this franchise, it’s the international market that made up the bulk of the revenue. Though the movies aren’t loved by US critics or audiences, the executives know they can still make a killing overseas.
Likewise, pay attention to the countries where you’re seeing the most downloads. Knowing your game is big in Japan can help you pivot strategy quickly in order to maximize revenue. Do you need to translate the game? Can you buy ad space on other games popular in Japan? Conversely, seeing lagging downloads in major countries can tell you that your current marketing strategy isn’t working.
2. Daily & Monthly Average Users
The DAU and MAU metrics are similar but give you very different insights. The DAU is a leading indicator of churn rate. A low DAU means that your app is not immediately making an impact in your user’s usage pattern and is ultimately forgettable. You want to aim for a DAU of 10% of downloads as a general rule of thumb; this is a healthy number that shows that your app is useful to a significant portion of your user base.
MAU speaks to long term stickiness, which leads directly to user retention. Depending on your app vertical, you’ll want to make sure your MAU is in line with the average, about 30% of downloads, if not better. Don’t forget that you should be counting uniqueusers for this metric and that they’re only counted when they take an action other than simply opening up the app.
Many analytics sites will say the DAU/MAU ratio is the statistic to pay attention to (and to aim for 33%), but again it all depends on your app category. For example, a magazine app that releases once a month will skew this stat.
3. Retention Over 1, 7, 30 Days
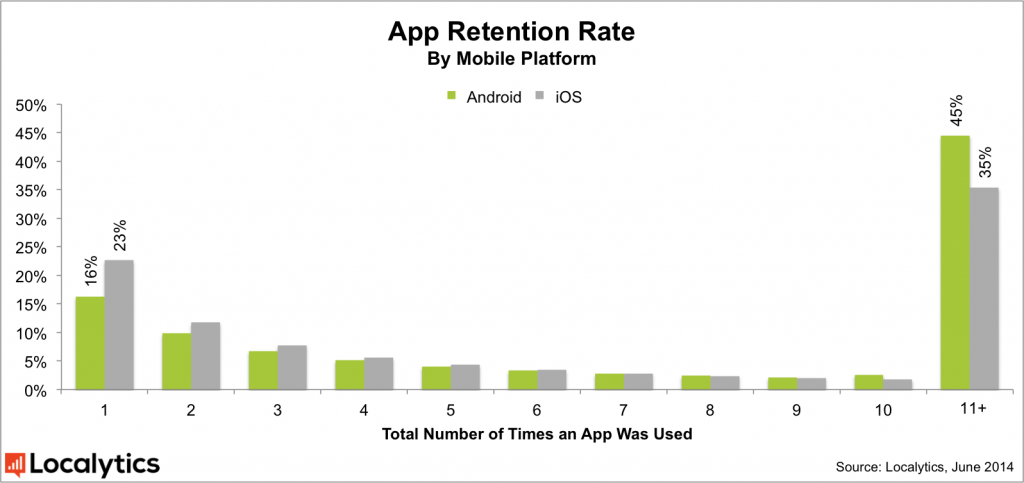
While retention numbers vary wildly between app categories (ie dating apps vs weather apps), in general only about 14% of users stuck around after the first day of downloading an app. After 7 days, retention drops to 10%, then 2.3% after 30 days. While these numbers seem abysmal, remember that the barrier of entry for users is very low — it’s just a click for them — but app downloads are a numbers game, and increasing this statistic by even one percent is meaningful. A submetric for retention, frequency of use, can be tracked on a day-to-day basic to determine engagement as a leading indicator of retention. Again, keep in mind the difference between app categories.
Side note, surprisingly Android has a better retention rate than Apple:

Source: Localytics
4. Session Intervals
Knowing how often your app is used is akin to whether your app is actually successful or not. A good way to measure frequency of use is to measure session intervals (the time between user activity) for the simple reason that some apps are never relaunched. Choose a minimum time between sessions, say 30 minutes of inactivity, so any new activity after 30 minutes counts as a new session.
The more frequently your app is used, the more likely your retention numbers will go up. Keep a close eye on your frequency of use metric in context of what is appropriate for the category of your app. For example, a social networking app should be used at least once a day, while a medical app may only be used once every few weeks. Statista has a good chart of how frequently apps in various categories are used each month.
5. Session Length
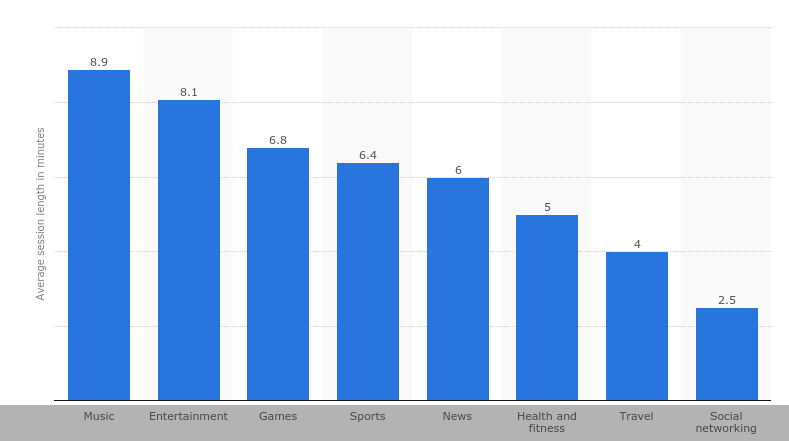
Session length is the other side of the coin to session interval: you want to know how long users actually spend using your app as much as you want to know how long it takes for them to come back. Measure session length (from app open to a set period of inactivity) meticulously for insights into how effective your app is in retaining your user’s attention.
For example, if your average session length for your game is 2 minutes, but it takes 3 minutes to complete a round, you know you have a big problem keeping the user engaged.

Source: Statista
There you have it, 5 usage metrics to track so you’ll have hard data on how much (or little) users are enjoying their experience with your app. To get these metrics, you’ll need to carefully instrument your app with an analytics package that isolates interactions down to the page view, especially since on that level you’ll get a wealth of information about how the app is actually being used (ie. where engagement really takes place). Start tracking these 5 key metrics from the initial release of your app for the best results.
Stay tuned for our part 2 of our metric series: tracking customer acquisition costs.
For more insights into the mobile app industry, follow our Twitter,Facebook, LinkedIn or RSS feeds.


